
The CFPB has released their new report, which details how people deal with their financial obligations.

You’ve heard of credit scores. What you may not have heard much about is “financial well-being” or the scores that come with it. Yet you can learn a lot from them.
Financial well-being is the circumstances in which people can fully meet current and recurring financial obligations, feel secure about their financial future, and have the flexibility of choices that allow them to enjoy their lives.
The Consumer Financial Protection Bureau, in conjunction with the Federal Reserve, has conducted its 9th annual Survey of Household Economics and Decision-making (SHED). Enacted in 2013, this survey assesses the economic health of U.S. households and identifies risks to financial stability.
The percentage of financially solvent adults has risen to its highest level since 2013. While the road to recovery will be fraught with financial challenges and risks, people’s generally positive assessments of their financial well-being indicate many Americans are seeing improved economic conditions.
Here are the highlights from this year’s CFPB survey.
Introducing “financial well-being scores”
Each year the CFPB examines the “association of financial well-being and a range of topics”. This year the topics covered were income, employment, dealing with unexpected expenses, banking and credit, housing, education, student loans, and retirement and investments.
4 central elements make up the concept of financial well-being:
- Day-to-day, month-to-month control over finances
- Ability to withstand a financial shock
- Can meet tracked financial goals
- Having financial freedom and freedom of choice
You get the CFPB’s financial well-being score when you put all those factors together. This graph shows what current financial well-being scores in the U.S. look like when grouped by age.
As you can see, the average financial well-being slopes upward until the early 60s, jumps up from the mid 60s to early 70s, then slopes gently downward into the 80s.
Want to know your financial well-being score? Take the CFPB’s test now!
The CFPB test is available to the public, so you can take the test now to see where your financial well-being stands. Scoring works on a 100-point scale and the current national average is just 55. That means that the average American gives themselves a failing grade for financial well-being.
Hopefully, you can score better. The test only takes a few minutes to complete. Just answer a few questions that rate how you feel about your finances. Once you complete the test, you’ll receive your score. They also show you how you rate versus the national average and among key demographics like age, income, and employment status.
Take the CFPB’s well-being test to see how you score »
Not happy with your financial well-being score? Finding the right solution to eliminate credit card debt is often the first step to take to begin improving your score.
Financial well-being is on the rise
The purpose of the financial well-being survey is to find out how average American families are faring when it comes to their finances. In its 9th year, the 2021 survey findings showed improved financial well-being for many Americans… but not all of them.
According to the Fed’s survey, 78% of adults said they were doing okay or living comfortably in 2021. That’s the highest level reached since the survey’s inception in 2013.
Income
Income is central to people’s financial well-being. To better understand how people think about and experience financial situations, studies have been done to define and measure financial well-being. Existing research, such as the Economic Well-Being of U.S. Households, uses typically objective measures to determine a household’s financial circumstances.
“Family income” which the survey tries to measure, refers income from all sources before taxes and deductions which the respondent and their spouse received the previous year. One-fourth of adults had a family income below $25,000 while one-third had $100,000 or more.
Income stability varies by race and ethnicity:
- 43% of Black adults and 40% of Hispanic adults had a family income below $25,000, at least twice the rate of White adults (20%) and Asian adults (17%)
- White adults (37%) and Asian adults (51%) were more likely to have a family income above $100,000, than Black adults (17%) and Hispanic adults (20%).
Assistance from nonprofits and private sources, including financial support from a friend or family member, can supplement family income. The 2021 results show that 7% of adults aged 21 and over received assistance from a friend or family member, while 15% received help from private or nonprofit sources. Adults with less than a high school degree were more likely (34%), to receive help from private or nonprofit sources.
Since most bills are paid monthly, a difference in monthly income can lead to serious financial challenges. Most adults’ income stayed the same each month, but 3 in 10 had changes in their income month to month in 2021.
Employment
In 2020, we saw record numbers of people lose their jobs due to the pandemic. The share of adults who were working in the latter half of 2021 still remained below the pre-pandemic level. Health (9%), COVID (7%), and family responsibilities (7%) were the biggest factors for people aged 25 to 54 not working.
Here’s a closer look at the employment challenges people reported facing in 2021:
Health concerns and limitations that come with it were cited as the most common reason for adults not going back to work last year. More than one in ten adults (12%0 in their prime, those between 25 and 55, were not working for one of these reasons. Disability or health limitations was the reason cited by 9% of survey respondents overall.
The percentage of prime-age adults who stated that they were not working because they could not obtain employment fell from 9% in 2020 back to 5% in 2021, the same before the pandemic.
Roughly 2% of prime-age adults said that the reason that they were not working was in part because they didn’t want to lose access to unemployment and other government assistance programs. For families that received government benefits in the 12 months prior, 6% said that these benefits played a part in them not working. Even among benefit recipients, other factors including concerns about COVID and an inability to find work were more likely to be cited as reasons for not working.
Prime-aged women were particularly likely to say they were not working because of children and other family obligations.
- 6% of women said their children were the reason for not being employed
- 10% cited other familial responsibilities, far exceeding men
It should be noted that the share of women not working because of child-bearing responsibilities didn’t increase relative to what it was pre-pandemic.
Another difference between prime-age men and women is that women were more likely to say they were not working, at least in part, due to the concerns about contracting COVID. Eight percent of women and 5 percent of men cited COVID as the reason for being unemployed. Previous studies have shown that workplaces, where there were more women, resulted in higher rates of COVID exposure. [1]
A factor in people’s decisions to work and where to work is their assessments of workplace safety, including what they are doing for COVID-19. More than three-quarters (77%) of employees thought that their employers were taking the right number of precautions to prevent others from getting infected. The rest were almost evenly split between thinking their employers took too many, 11%, and too few, 12%.
In terms of specific precautions, just under a quarter of employees said that their employer had a policy requiring vaccination. An additional 19% of employees said that employees could either be vaccinated or be tested regularly. Less than half (49%) said their employer had no specific vaccine or testing requirement.
Employees split almost evenly when it comes to having vaccine requirements at their workplaces. 49% said that they want their employer to require vaccinations, while 51% do not. Employees who had the vaccine themselves made up a higher portion of those who wanted the vaccine, 59%. Only 4% of those who were not vaccinated wanted to require vaccines.
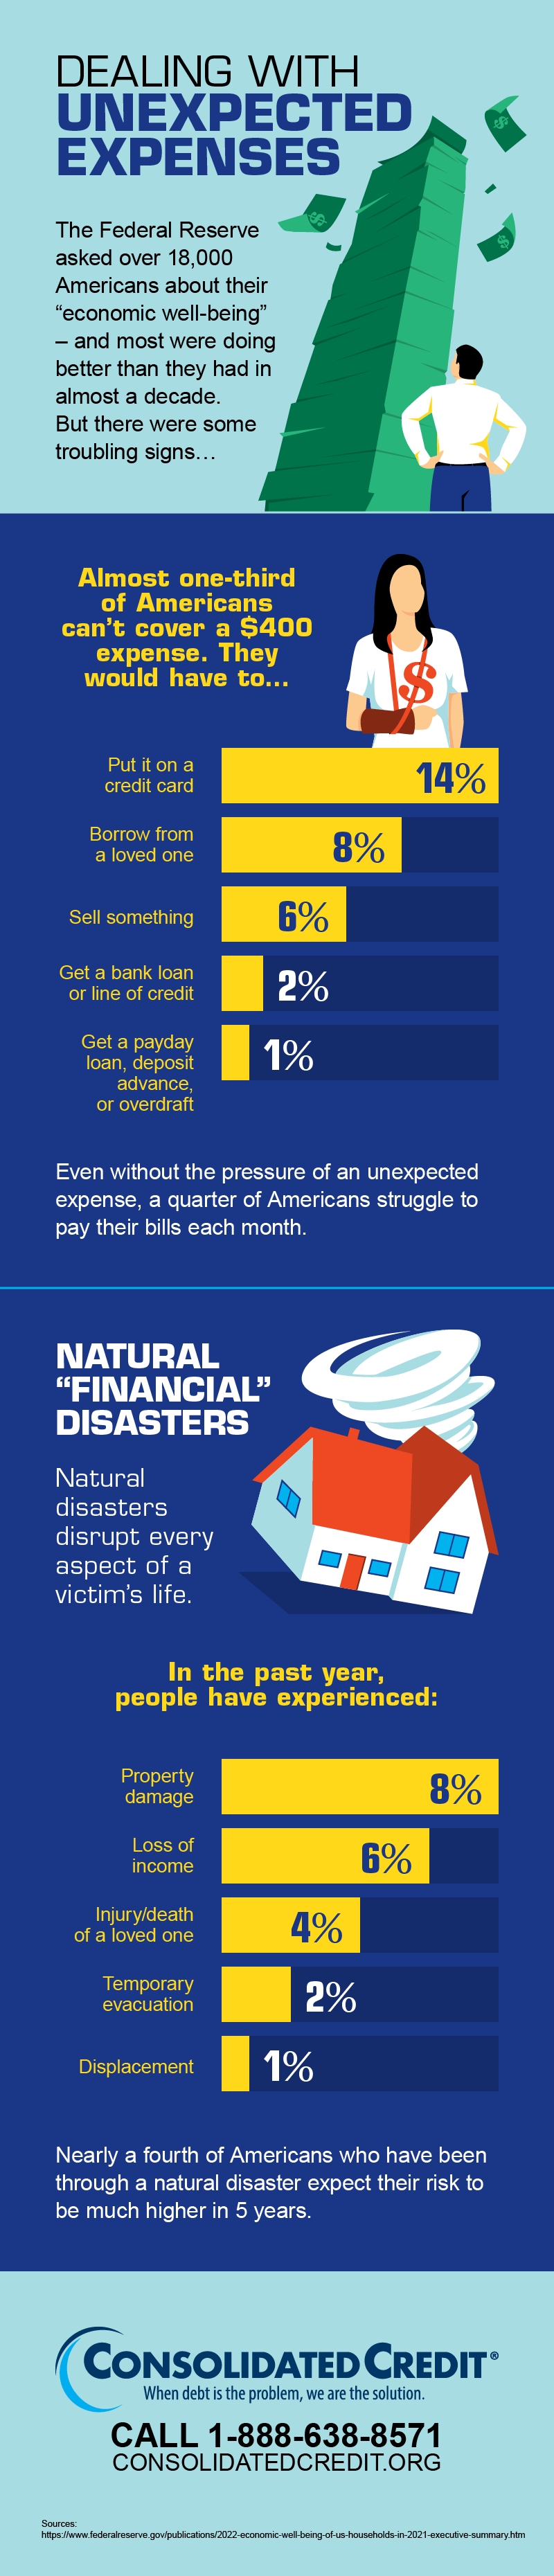
Unexpected Expenses
Banking
Access to financial services from banks and credit unions can be important for people’s financial well-being. Most adults had a bank account and were able to obtain credit from mainstream sources in 2021. However, notable gaps in access to basic financial services still exist among Black and Hispanic adults and those with low income.
In 2021 fewer people were denied credit than previous years, and the number of adults who described themselves as “very confident” of being approved if they applied rose to the highest levels since 2015. Use of alternative financial services like money orders, check cashing, and payday loans remained unchanged after declining in 2020.
Most Americans (81% of adults in the United States) are “fully banked.” That means they have a bank account and did not use any of the alternative financial services within the last 12 months.
Additionally, 13% additionally had a bank account but used alternative financial services. Adults who do this are considered “underbanked” due to the banking services they accessed appearing to be insufficient to meet their financial needs.
The remainder of the adult population (6%) did not have a bank account. Less than half of these “unbanked” adults used alternative financial services.
Adults with lower income, less education, and Black and Hispanic adults had higher unbanked and underbanked rates. 24% of adults without a high school degree, and 17% with income below $25,000 were unbanked. The share of people with income under $25,000 without a bank account far exceeded that of the two highest income levels. Because of this, 79% of all unbanked adults had income below $25,000 and 91% had income below $50,000.
Adults with less education and adults with lower income were also more likely to be underbanked. Nearly a quarter of those with less than a high school degree and 20% of those with income less than $25,000 were underbanked. Lower-income adults were more likely to use cryptocurrencies for transaction purposes.
From 2020 to 2021 the number of unbanked, underbanked, and fully banked adults was almost unchanged. A longer-term pattern shows a 7% decline in underbanked rates since 2015, with a 2% increase in the number of adults with a bank account. Much of the decline in underbanked rates reflects the decline in the use of alternative financial services.
This decline does not necessarily reflect improvements in financial inclusion, however. The market for financial products and services has been evolving during this time.
Credit cards

Credit cards are a mainstay in our culture, but people use them in very different ways. Some use credit cards as a convenient way to pay for expenses, paying off their balances in full each month and avoiding interest costs. Others will, unfortunately, carry a balance and use credit cards to defer paying costs.
The majority of adults (84%) had a credit card in 2021. They were almost evenly split between people who paid off their balances and those who carry their balances from month to month. It was reported that 73% of people carry a balance.
The survey results show that income is a major determining factor in credit card usage. But interestingly enough, a low income doesn’t necessarily mean that you have the highest balances.
- For individuals who make over $100,000, 98% had a credit card, with only 36% carrying a balance.
- Adults who made between $25,000 – $49,999 and $50,000 – $99,999 had the highest percentage of carrying their debt, at 49% and 47% respectively. This is due to them most likely having them to finance their purchases. T
- hose that made less than $25,000, had the lowest percentage of those who carry their debt at 33%.
The cost of housing and housing tenure type affect people’s economic well-being. While the majority of adults own their homes, those who did rent were disproportionately lower income, Black or Hispanic. The number of renters behind on their rent in the prior 12 months, is at a higher level than before COVID-19.
Housing
The cost of housing and housing tenure type affect people’s economic well-being. While the majority of adults own their homes, those who did rent were disproportionately lower income, Black or Hispanic. The number of renters behind on their rent in the prior 12 months, is at a higher level than before COVID-19.
Education
Widely considered a path to higher income and greater financial well-being, education plays a big role in how comfortable people are in their financial lives. Self-reported financial well-being rises significantly through higher education. More than half of adults who went to college believed that the lifetime financial benefits of higher education exceed the financial costs.
Of course, the self-assessed value of higher education,often depends heavilh on people’s educational experiences. Those who received their degree are more likely to see the benefits than those who did not. However, 31% of people who didn’t receive their degree still said the education outweighed the cost. But that numbers jumps for those who received their associate’s or bachelor’s degree to 46% and 67% respectively.
Age also plays a role in those who believe the value of an education offset the costs. For those with at least an associate degree, older adults were more likely than younger adults to see the benefits of their studies. One theory proposed is that older adults had more time to see the benefits of their experience. Rising costs of college could also cause a variation in viewpoints. Between 2009-10 and 2019-20, the overall cost of attendance saw an increase of 39.9% at 4-year public universities, while private universities underwent a 44.2% rise. [2]
For those with an associate degree, 4 in 10 adults under 30 believed the benefits of education exceeded the costs, while in adults aged 60 and over the ratio rose to 6 in 10. The gap is wider for bachelor’s degrees, with 56% of adults under 30 believing that the benefits of their education exceed the cost, compared with 82% of those 60 or older.
Improving financial well-being if you’re not feeling secure
“The good news in these reports is that overall, Americans appear to be becoming more financially secure,” says Gary Herman, President of Consolidated Credit. “That’s a good sign, but we need to do more to help those who are still feeling less secure.”
Herman says the solution is often improved financial education. The more people understand the basics of managing money, building credit, and avoiding debt, the more likely they are to be able to achieve stability.
“An individual’s chances for living comfortably are greatly increased when they have the right knowledge to overcome financial challenges,” Herman explains.
“The focus needs to be on providing financial education to low-income communities. Financial education still isn’t a part of most public-school curriculums. As a result, most kids learn finance from their parents. Parents who are struggling to make ends meet, particularly in a single-parent household, may not have the time or resources to teach their children good financial habits. As a result, financial well-being isn’t a skill set that gets passed down from one generation to the next. Programs need to be provided that intervene to provide the right resources, so we can break the cycle.”
Consolidated Credit works with and supports organizations like the United Way and Junior Achievement to get financial education to the audiences that need it most. These community outreach initiatives are designed to help groups that are most at risk of financial insecurity.
“If you’re struggling to live comfortably, seek out free programs in your community that can help you learn how to achieve stability,” Herman encourages. “And if you’re a parent, find programs through organizations like Junior Achievement that can give your children the head start they need to be successful.”
Sources:
[2] Average Cost of College Over Time: Yearly Tuition Since 1970 (educationdata.org)
